| |
This is an example of what a graph of exponential growth would look like.
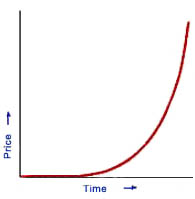
In the beginning, when only small amounts are doubling, the line does not seem to show a noticeable increase, but once the doubling amounts begin to get larger the line goes almost straight up.
Image credits for this page:
exponential graph: Gran
Please read: About images and copyright.
|
|
 |
|
D O  T H E M A T H - O U R P O P U L A T I O N G R O W T H R A T E I S U N S U S T A I N A B L E T H E M A T H - O U R P O P U L A T I O N G R O W T H R A T E I S U N S U S T A I N A B L E
Example 1 - The cost of a bus pass
From the previous page we know that if something is increasing at a rate of 7% per year, the doubling time is
70 divided by 7 = 10 years
If the cost of a one-month bus pass is growing at 7% per year, and in 2001 it cost $5, you know price will double in 10 years. Thus, in 2011, your bus pass costs 2 x the amount, or $10. Examine this table for a minute to see what your one-month bus pass will cost 70 or 80 years from now, when you are a grandparent.
2001
2011
2021
2031
2041
2051
2061
2071
2081
2091
|
$5
$10
$20
$40
$80
$160
$320
$640
$1280
$2560
|
This is what 7% growth means. In just 10 doubling times it will be 1000 times the amount it was when it started. Most people dont understand this at all!
Example 2 - House prices
Here is another example that may affect you and your parents. On the KW Commercial blog, taken from the Keller-Williams Real Estate Market update, I found The Real Estate Market Statistics for Canada and Kitchener Waterloo, and learned that housing prices increased 18% from February 2009 to February 2010.
Real Estate prices fluctuate, they dont usually grow steadily, but IF they were to continue to grow steadily at a rate of 18% per year, how would we find out the doubling time? 70 ÷ 18 = 3.89. We can round that up to 4. It's important that you notice that the rate of growth is 18% per decade, not per year. (A decade is 10 years) So, at an 18% per decade growth rate, you could expect the price of your house to double in 4 decades.
...read more
|